- Welcome
- Family History
- Letters & Diaries
- Folder: 1840 - 1859
- Statement of the White Population of each county of the State'
 Statement of the White Population of each county of the State'
- » Date: 1848-01-05
- » Subject: Statement of the White Population of each county of the State'
- » Written By: unknown
- » Addressed To: unknown
- » Transcriber: Alice Hix
- » File # 1067
 Page 1 Image
Click to see the full imagePage 1
 Page 1 Image
Click to see the full image
|
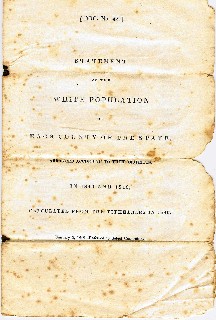
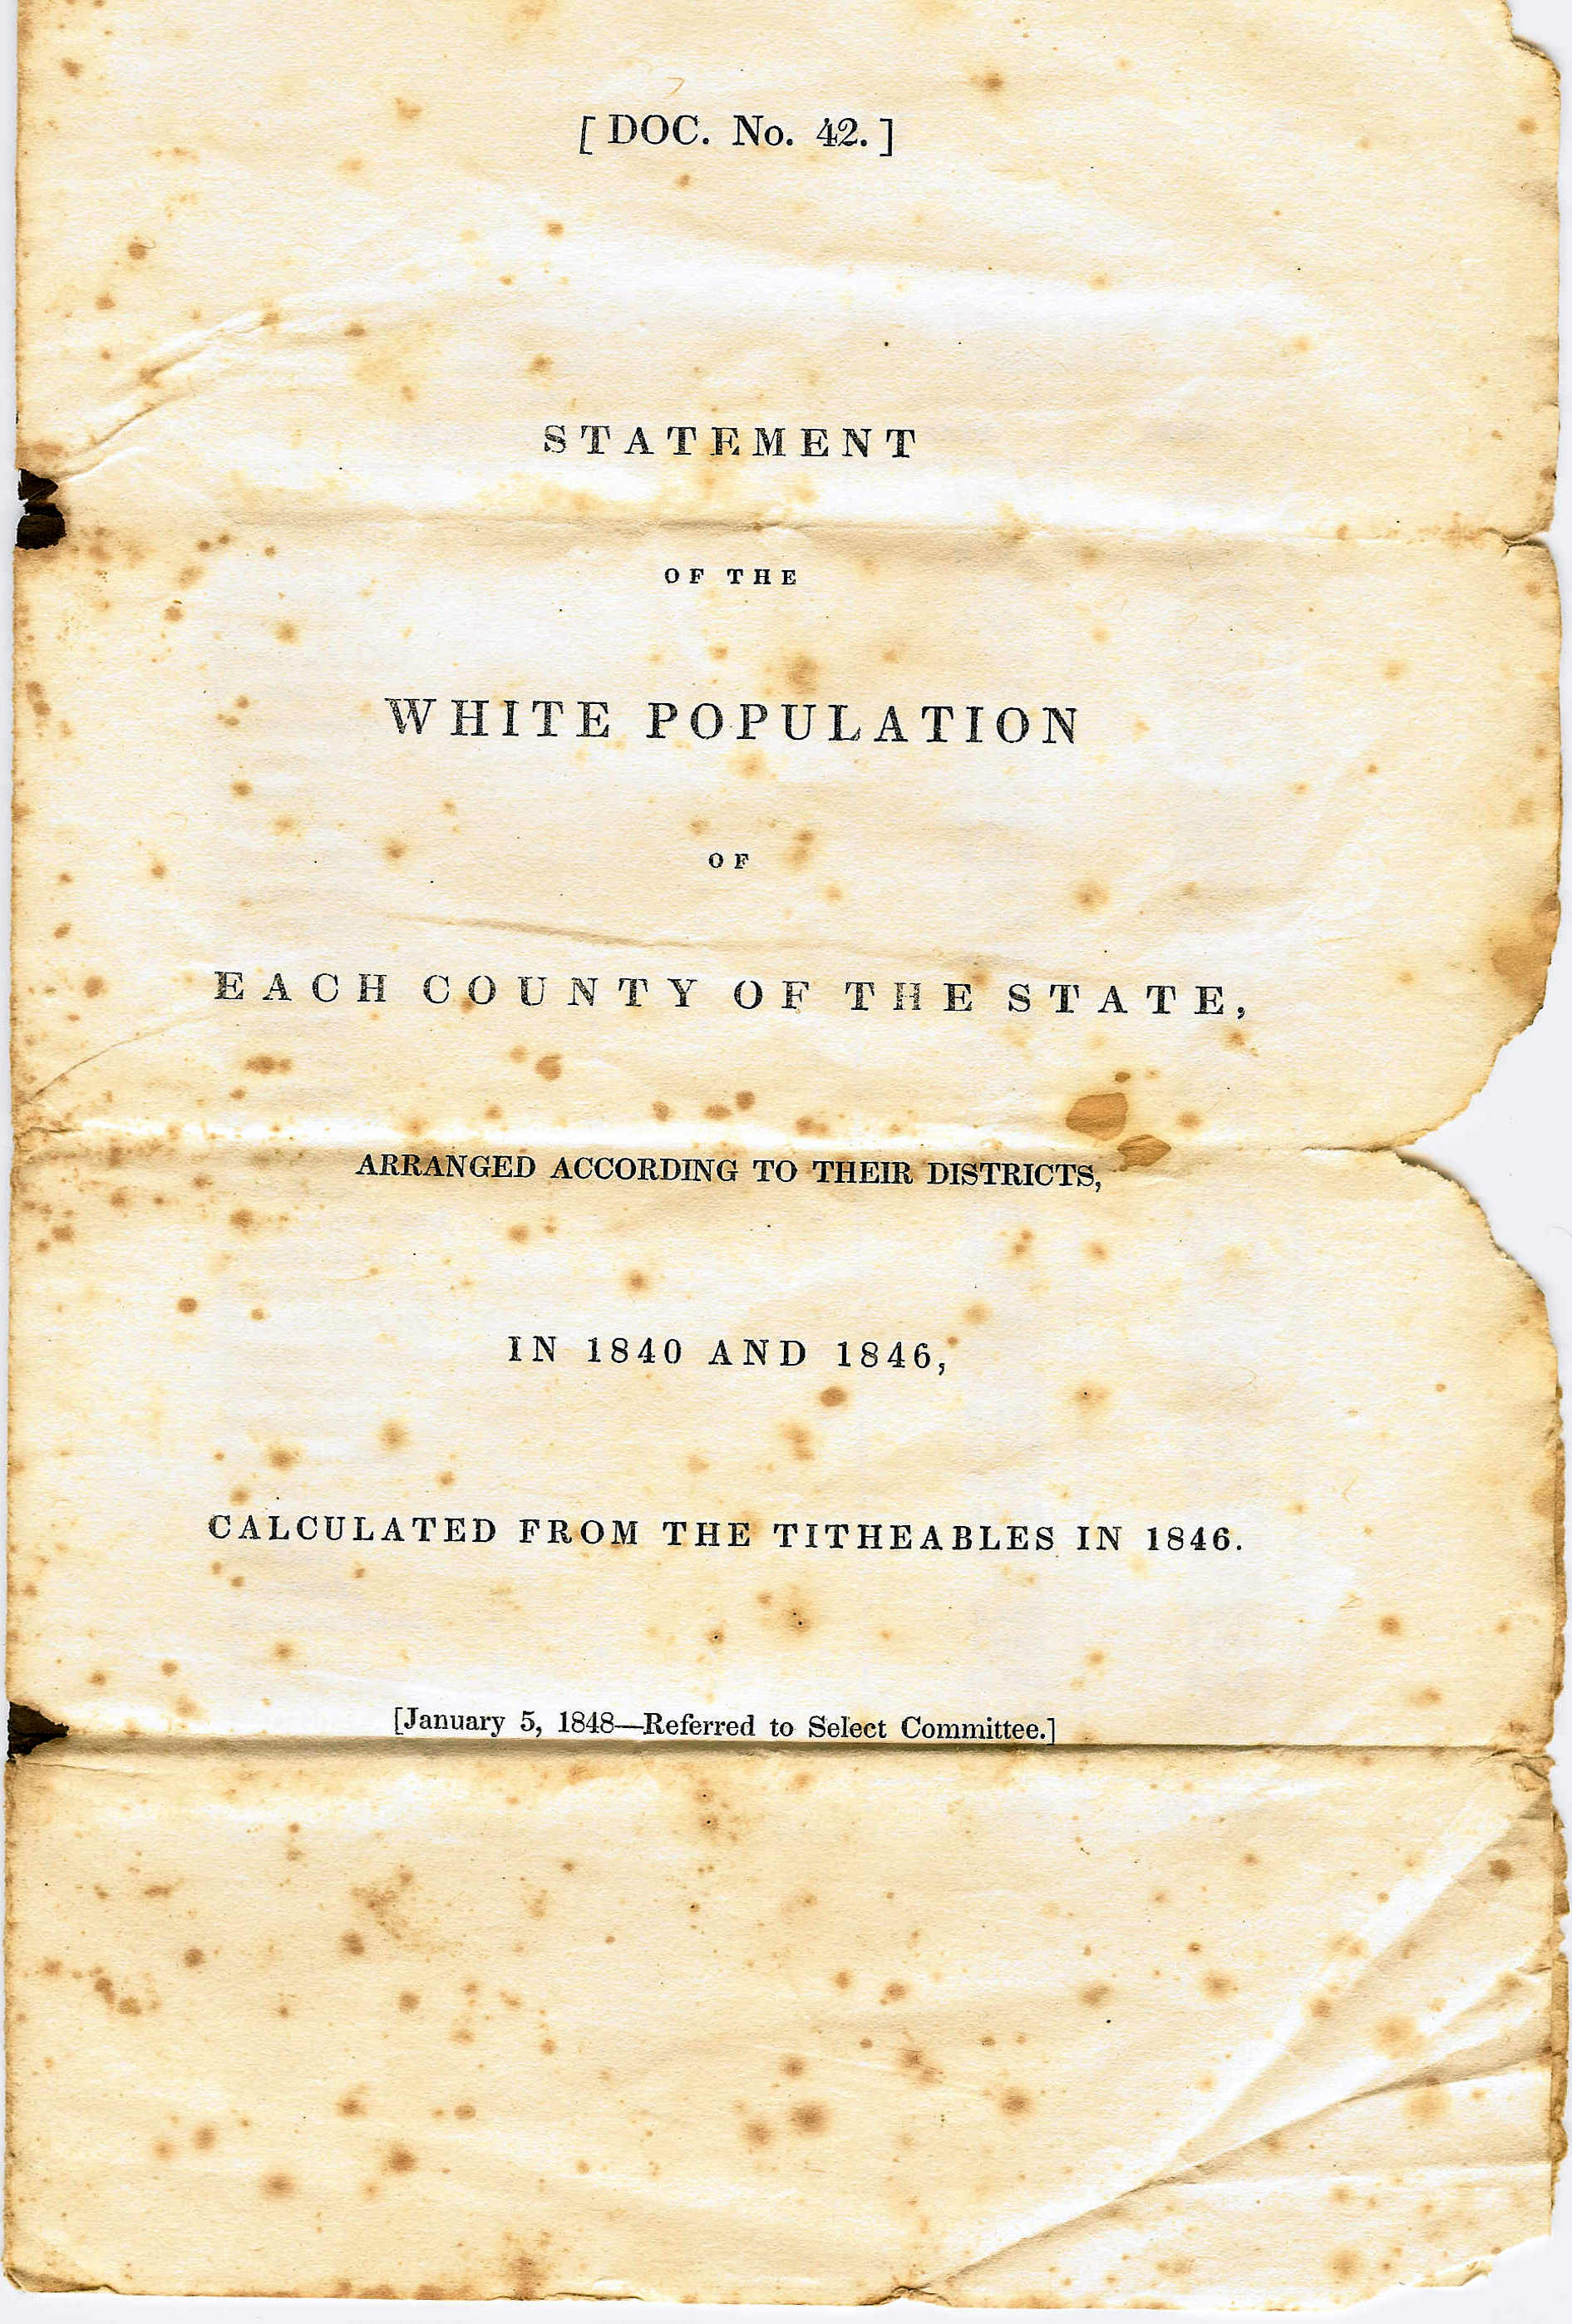
[DOC. No. 42} |
|
STATEMENT |
|
Of the |
|
WHITE POPULATION |
|
Of |
|
EACH COUNTY OF THE STATE, |
|
Arranged According to Their Districts, |
|
In 1840 and 1846, |
|
Calculated from the Titheables in 1846. |
|
[January 5, 1848-Referred to Select Committee.] |
 Page 2 Image
Click to see the full imagePage 2
 Page 2 Image
Click to see the full image
|
4 |
[Doc. No. 42.] |
|
[Doc. No. 42.] |
5 |
||||
|
|
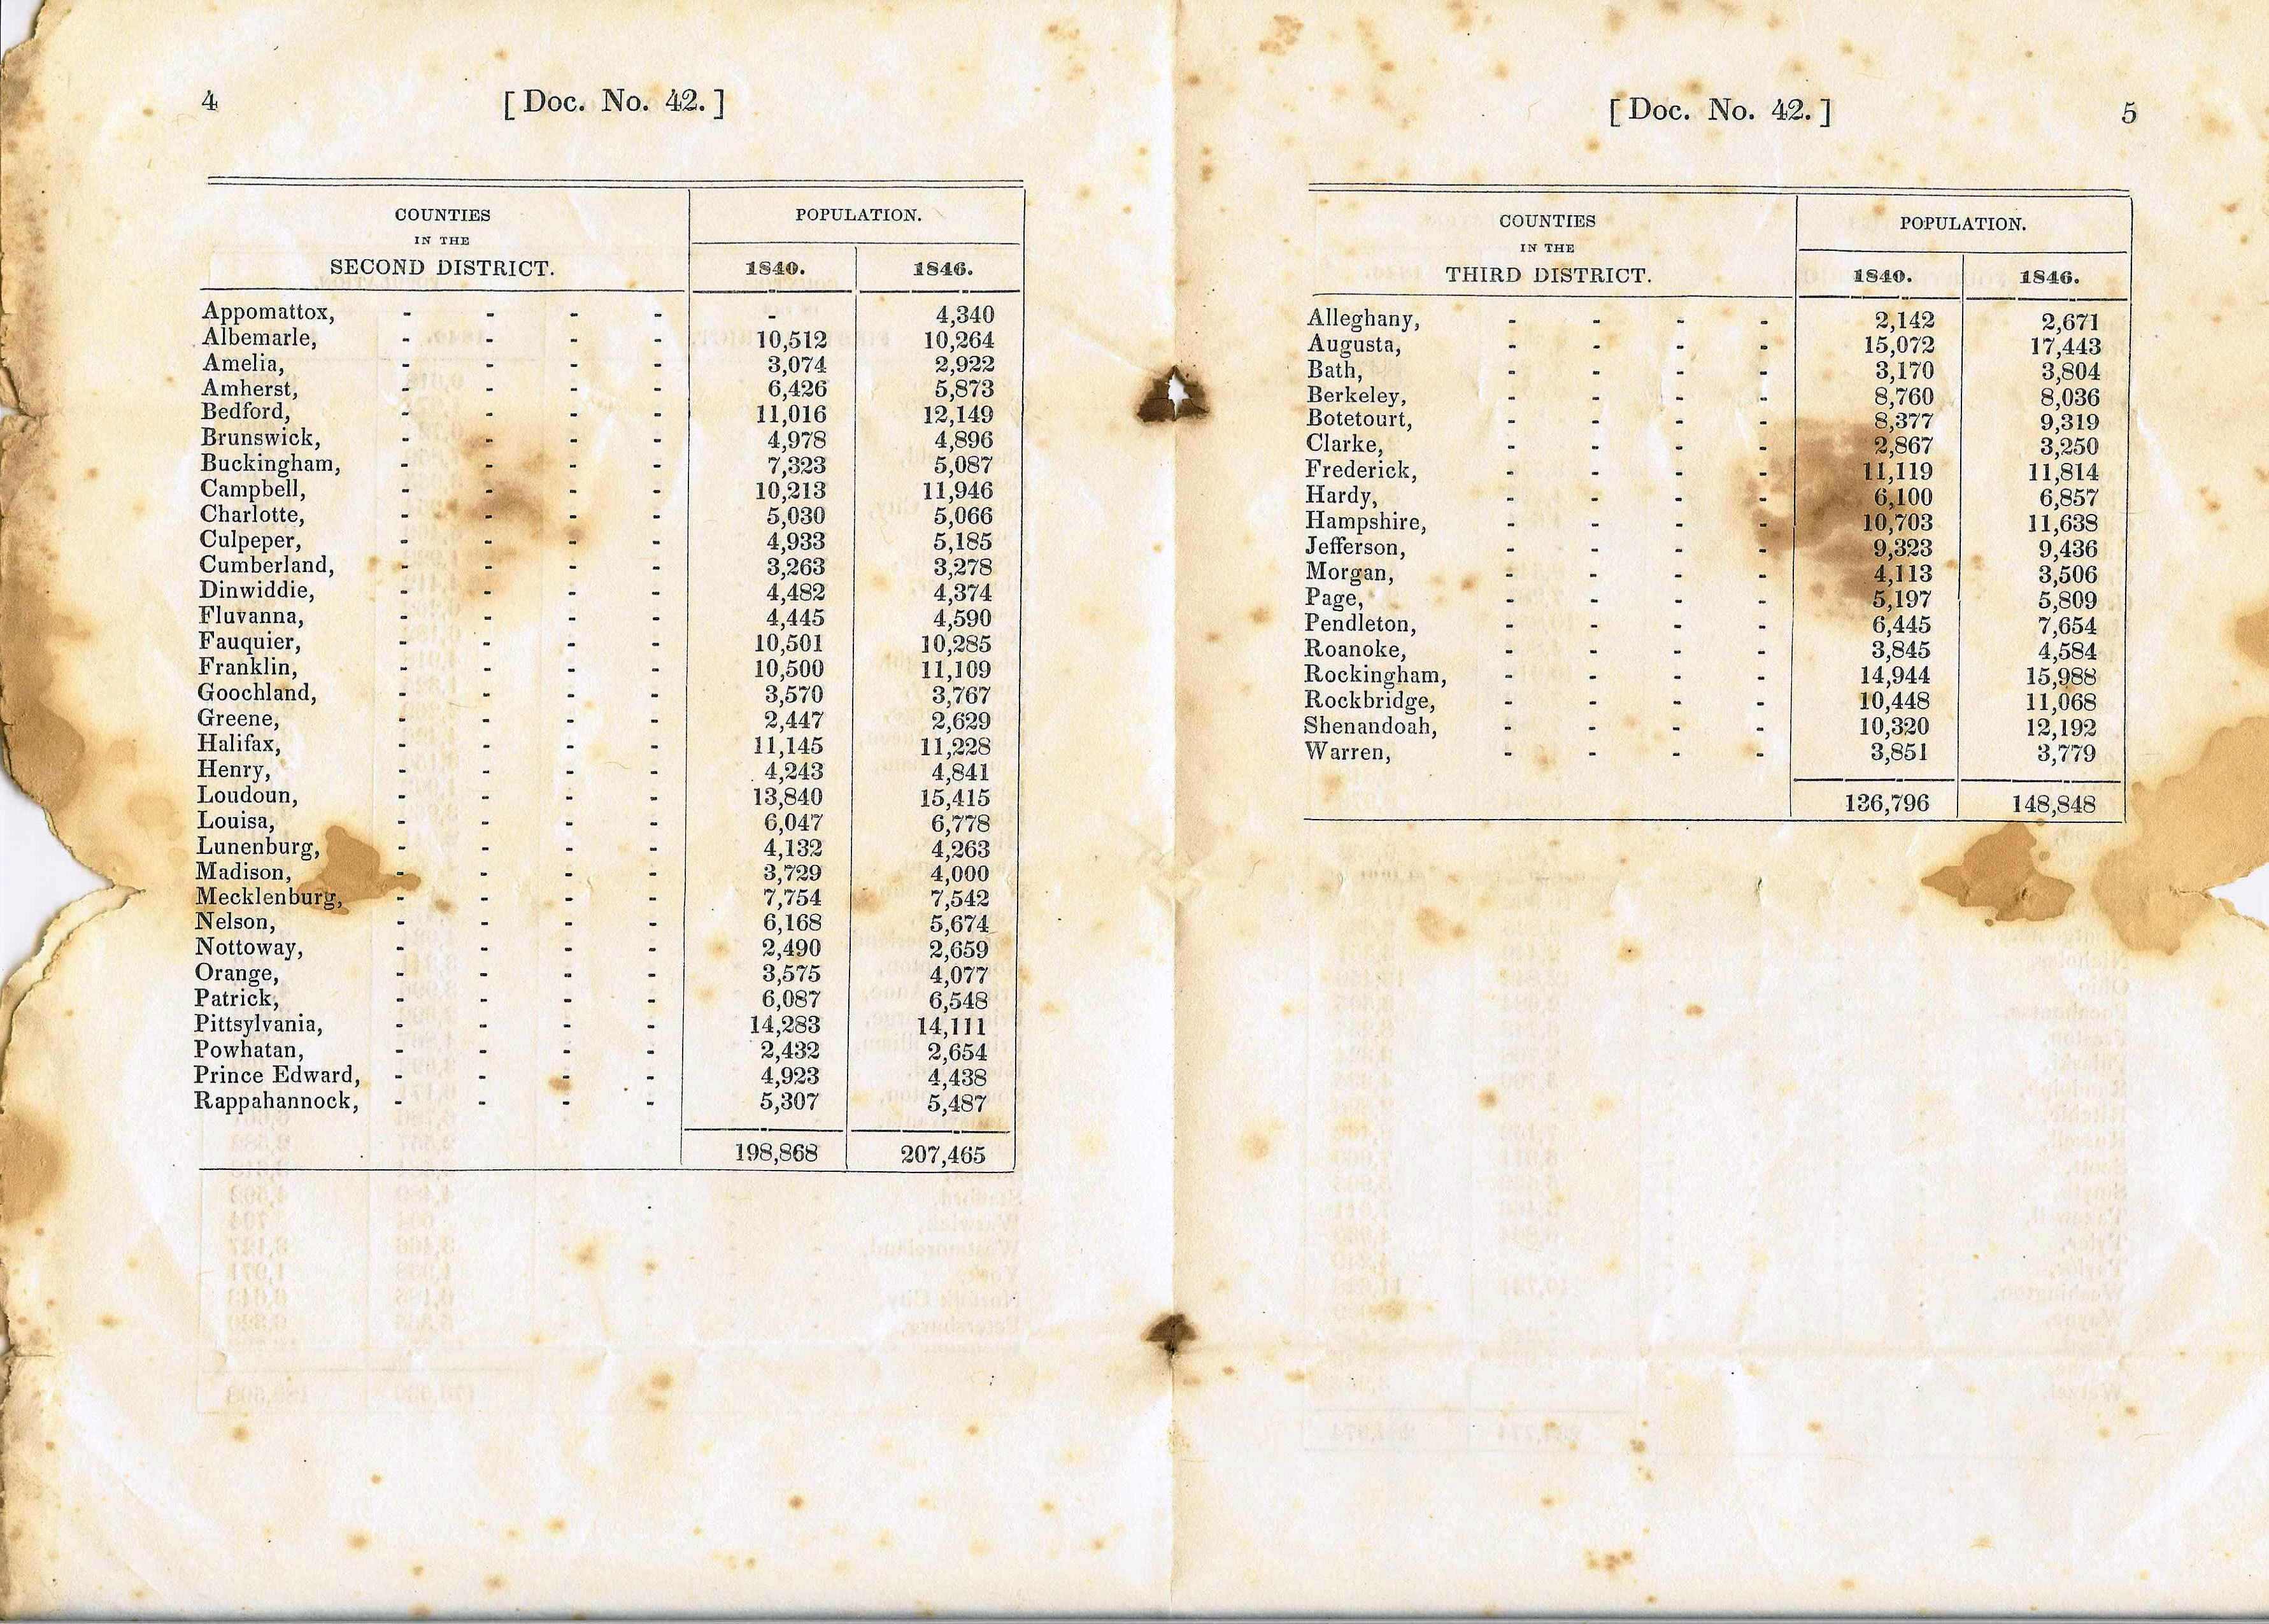
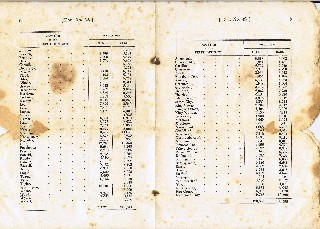
Counties in the Second District |
Population. |
|
Counties in the Third District |
Population. |
|
||
|
|
|
1840 |
1846 |
|
|
1840 |
1846 |
|
|
|
Appomattox |
0 |
4,340 |
|
Alleghany |
2,142 |
2,671 |
|
|
|
Albemarle |
10,512 |
10,264 |
|
Augusta |
15,072 |
17,443 |
|
|
|
Amelia |
3,074 |
2,922 |
|
Bath |
3,170 |
3,804 |
|
|
|
Amherst |
6,426 |
5,873 |
|
Berkeley |
8,760 |
8,036 |
|
|
|
Bedford |
11,016 |
12,149 |
|
Botetourt |
8,377 |
9,319 |
|
|
|
Brunswick |
4,978 |
4,896 |
|
Clarke |
2,867 |
3,250 |
|
|
|
Buckingham |
7,323 |
5,087 |
|
Frederick |
11,119 |
11,814 |
|
|
|
Campbell |
10,213 |
11,946 |
|
Hardy |
6,100 |
6,857 |
|
|
|
Charlotte |
5,030 |
5,066 |
|
Hampshire |
10,703 |
11,638 |
|
|
|
Culpeper |
4,933 |
5,185 |
|
Jefferson |
9,323 |
9,436 |
|
|
|
Cumberland |
3,263 |
3,278 |
|
Morgan |
4,113 |
3,506 |
|
|
|
Dinwiddle |
4,482 |
4,374 |
|
Page |
5,197 |
5,809 |
|
|
|
Fluvanna |
4,445 |
4,590 |
|
Pendleton |
6,445 |
7,654 |
|
|
|
Fauquier |
10,501 |
10,285 |
|
Roanoke |
3,845 |
4,584 |
|
|
|
Franklin |
10,500 |
11,109 |
|
Rockingham |
14,944 |
15,988 |
|
|
|
Goochland |
3,570 |
3,767 |
|
Rockbridge |
10,448 |
11,068 |
|
|
|
Greene |
2,447 |
2,629 |
|
Shenandoah |
10,320 |
12,192 |
|
|
|
Halifax |
11,145 |
11,228 |
|
Warren |
3,851 |
3,779 |
|
|
|
Henry |
4,243 |
4,841 |
|
|
136,796 |
148,848 |
|
|
|
Loudoun |
13,840 |
15,415 |
|
|
|
|
|
|
|
Louisa |
6,047 |
6,778 |
|
|
|
|
|
|
|
Lunenburg |
4,132 |
4,263 |
|
|
|
|
|
|
|
Madison |
3,729 |
4,000 |
|
|
|
|
|
|
|
Mecklenburg |
7,754 |
7,542 |
|
|
|
|
|
|
|
Nelson |
6,168 |
5,674 |
|
|
|
|
|
|
|
Nottoway |
2,490 |
2,659 |
|
|
|
|
|
|
|
Orange |
3,575 |
4,077 |
|
|
|
|
|
|
|
Patrick |
6,087 |
6,548 |
|
|
|
|
|
|
|
Pittsylvania |
14,283 |
14,111 |
|
|
|
|
|
|
|
Powhatan |
2,432 |
2,654 |
|
|
|
|
|
|
|
Prince Edward |
4,923 |
4,438 |
|
|
|
|
|
|
|
Rappahannock |
5,307 |
5,487 |
|
|
|
|
|
|
|
|
198,868 |
207,465 |
|
|
|
|
|
 Page 3 Image
Click to see the full imagePage 3
 Page 3 Image
Click to see the full image
|
6 |
[Doc. No. 42.] |
|
[Doc. No. 42.] |
3 |
||||
|
|
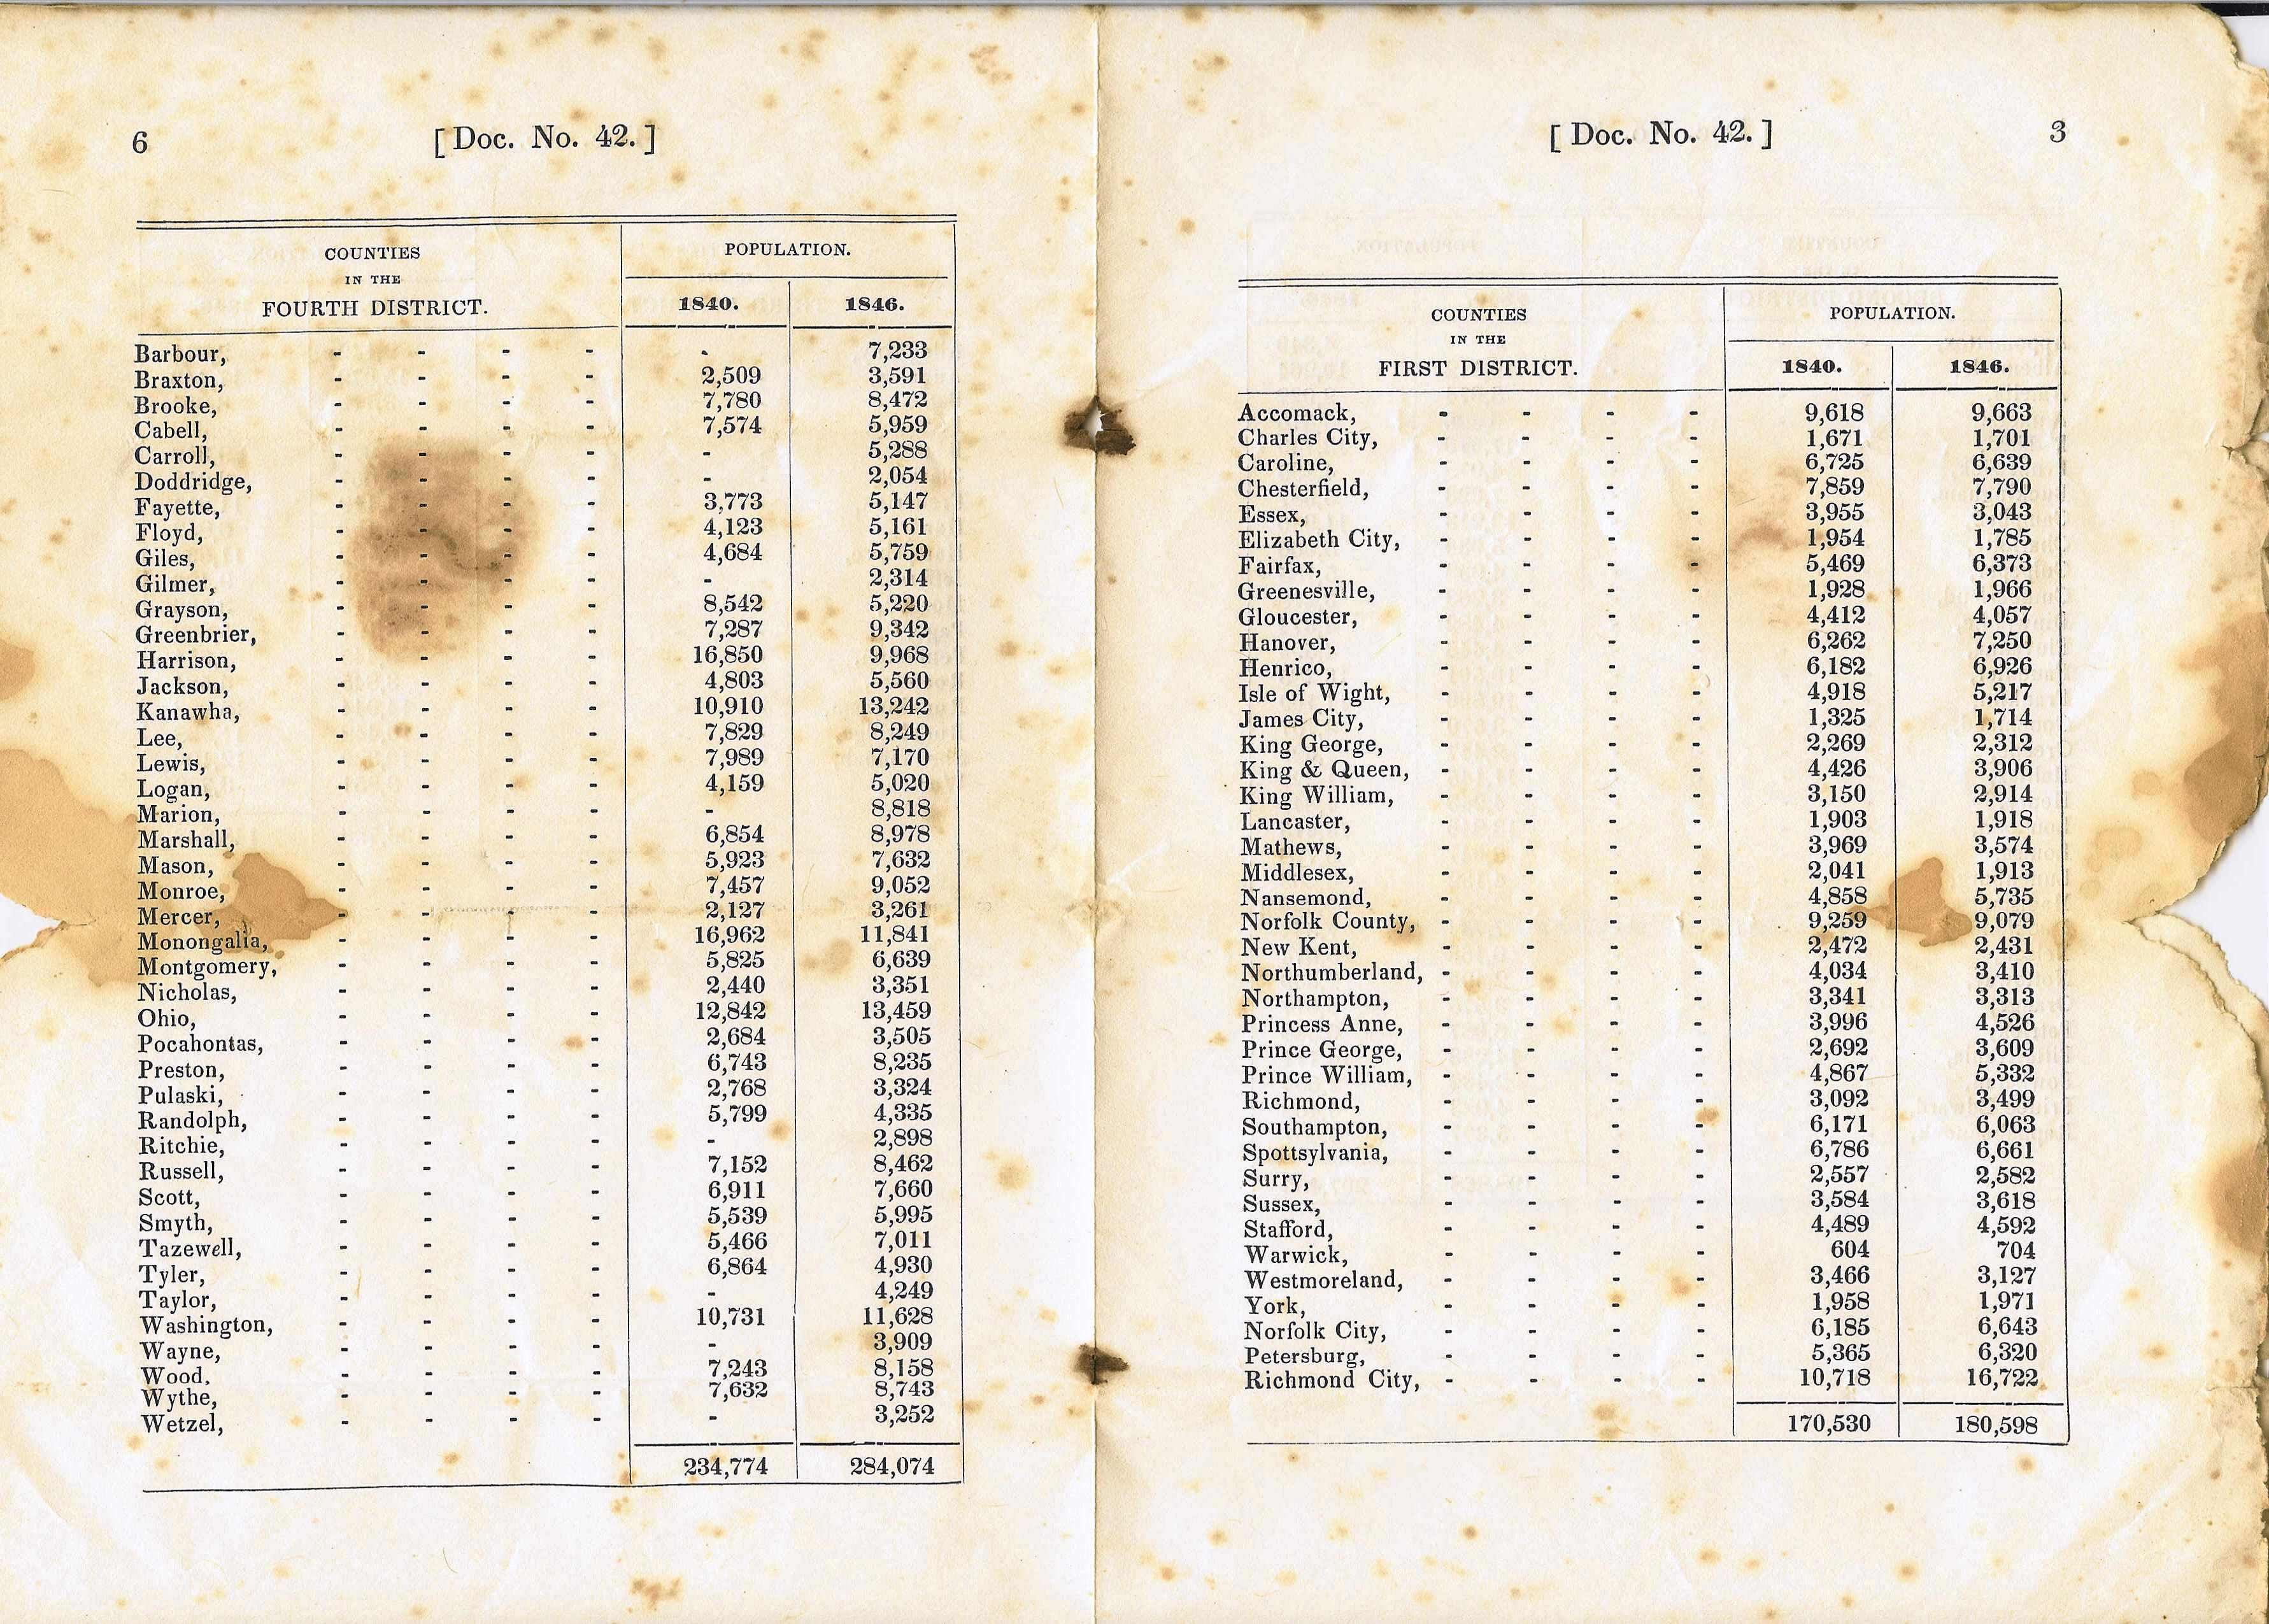
Counties in the Fourth District |
Population. |
|
Counties in the First District |
Population. |
|
||
|
|
|
1840 |
1846 |
|
|
1840 |
1846 |
|
|
|
Barbour |
0 |
7,233 |
|
Accomack |
9,618 |
9,663 |
|
|
|
Braxton |
2,509 |
3,591 |
|
Charles City |
1,671 |
1,701 |
|
|
|
Brooke |
7,780 |
8,472 |
|
Caroline |
6,725 |
6,639 |
|
|
|
Cabell |
7,574 |
5,959 |
|
Chesterfield |
7,859 |
7,790 |
|
|
|
Carroll |
0 |
5,288 |
|
Essex |
3,955 |
3,043 |
|
|
|
Doddridge |
0 |
2,054 |
|
Elizabeth City |
1,954 |
1,785 |
|
|
|
Fayette |
3,773 |
5,147 |
|
Fairfax |
5,469 |
6,373 |
|
|
|
Floyd |
4,123 |
5,161 |
|
Greeneville |
1,928 |
1,966 |
|
|
|
Giles |
4,684 |
5,759 |
|
Gloucester |
4,412 |
4,057 |
|
|
|
Gilmer |
0 |
2,314 |
|
Hanover |
6,262 |
7,250 |
|
|
|
Grayson |
8,542 |
5,220 |
|
Henrico |
6,182 |
6,926 |
|
|
|
Greenbrier |
7,287 |
9,342 |
|
Isle of Wight |
4,918 |
5,217 |
|
|
|
Harrison |
16,850 |
9,968 |
|
James City |
1,325 |
1,714 |
|
|
|
Jackson |
4,803 |
5,560 |
|
King George |
2,269 |
2,312 |
|
|
|
Kanawha |
10,910 |
13,242 |
|
King & Qreen |
4,426 |
3,906 |
|
|
|
Lee |
7,829 |
8,249 |
|
King William |
3,150 |
2,914 |
|
|
|
Lewis |
7,989 |
7,170 |
|
Lancaster |
1,903 |
1,918 |
|
|
|
Logan |
4,159 |
5,020 |
|
Mathews |
3,969 |
3,574 |
|
|
|
Marion |
0 |
8,818 |
|
Middlesex |
2,041 |
1,913 |
|
|
|
Marshall |
6,854 |
8,978 |
|
Nansemond |
4,858 |
5,735 |
|
|
|
Mason |
5,923 |
7,632 |
|
Norfolk County |
9,259 |
9,079 |
|
|
|
Monroe |
7,457 |
9,052 |
|
New Kent |
2,472 |
2,431 |
|
|
|
Mercer |
2,127 |
3,261 |
|
Northumberland |
4,034 |
3,410 |
|
|
|
Monongalia |
16,962 |
11,841 |
|
Northampton |
3,341 |
3,313 |
|
|
|
Montgomery |
5,825 |
6,639 |
|
Princess Anne |
3,996 |
4,526 |
|
|
|
Nicholas |
2,440 |
3,351 |
|
Prince George |
2,692 |
3,609 |
|
|
|
Ohio |
12,842 |
13,459 |
|
Prince William |
4,867 |
5,332 |
|
|
|
Pocahontas |
2,684 |
3,505 |
|
Richmond |
3,092 |
3,499 |
|
|
|
Preston |
6,743 |
8,235 |
|
Southampton |
6,171 |
6,063 |
|
|
|
Pulaski |
2,768 |
3,324 |
|
Spottsylvania |
6,786 |
6,661 |
|
|
|
Randolph |
5,799 |
4,335 |
|
Surry |
2,557 |
2,582 |
|
|
|
Ritchie |
0 |
2,898 |
|
Sussex |
3,584 |
3,618 |
|
|
|
Russell |
7,152 |
8,462 |
|
Stafford |
4,489 |
4,592 |
|
|
|
Scott |
6,911 |
7,660 |
|
Warwick |
604 |
704 |
|
|
|
Smyth |
5,539 |
5,995 |
|
Westmoreland |
3,466 |
3,127 |
|
|
|
Tazewell |
5,466 |
7,011 |
|
York |
1,958 |
1,971 |
|
|
|
Tyler |
6,864 |
4,930 |
|
Norfolk City |
6,185 |
6,643 |
|
|
|
Taylor |
0 |
4,249 |
|
Petersburg |
5,365 |
6,320 |
|
|
|
Washington |
10,731 |
11,628 |
|
Richmond City |
10,718 |
16,722 |
|
|
|
Wayne |
0 |
3,909 |
|
|
170,530 |
180,598 |
|
|
|
Wood |
7,243 |
8,158 |
|
|
|
|
|
|
|
Wythe |
7,632 |
8,743 |
|
|
|
|
|
|
|
Wetzel |
0 |
3,252 |
|
|
|
|
|
|
|
|
234,774 |
284,074 |
|
|
|
|
|
 Page 4 Image
Click to see the full imagePage 4
 Page 4 Image
Click to see the full image
|
[Doc. No. 42.] |
|
|
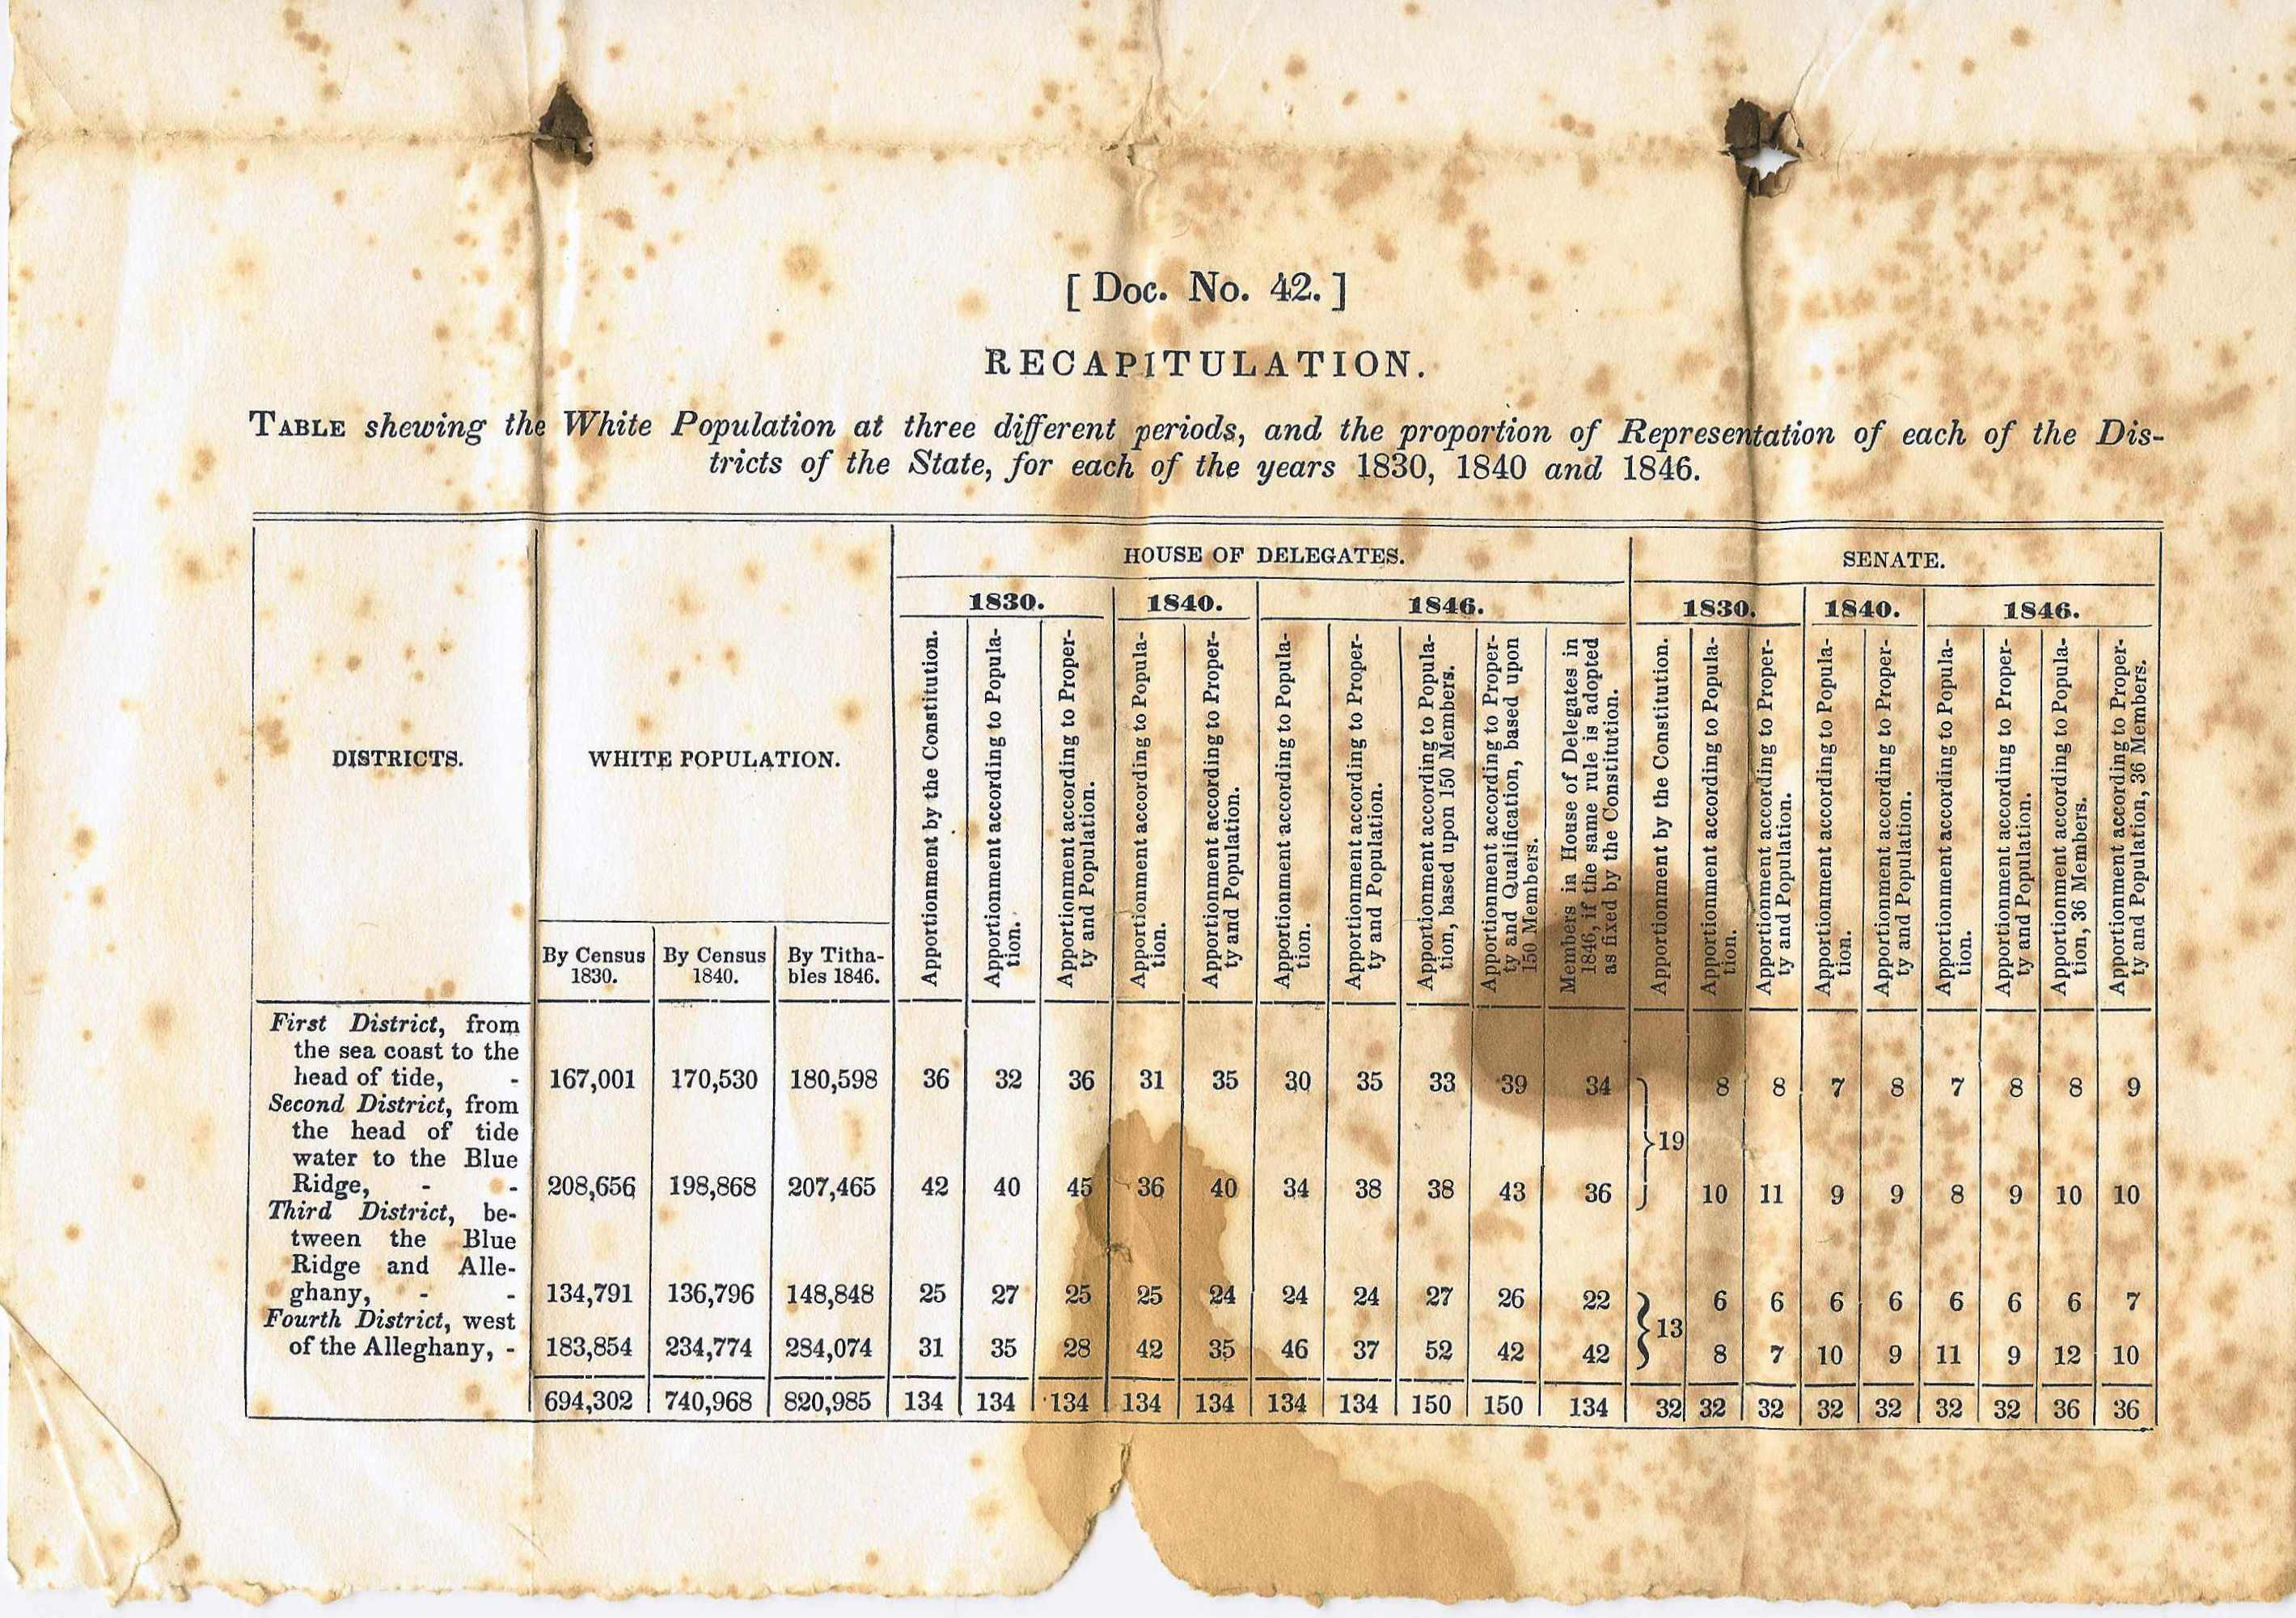
RECAPITULATION. |
|
|
TABLE shewing the White Population at three different periods, and the proportion of Representation of each of the Districts of the State, for each of the years 1830, 1840 and 1846. |
|
|
|
|
|
Districts |
|
|
|
First District, from the sea coast to the head of tide, |
|
|
Second District, from the head of tide water to the Blue Ridge |
|
|
Third District, between the Blue Ridge and Alleghany |
|
|
Fourth District, west of the Alleghany |
|
|
|
|
Apportionment Heading Descriptions |
|
|
A |
Apportionment by the Constitution. |
|
B |
Apportionment according to Population |
|
C |
Apportionment according to Property and Population |
|
D |
Apportionment according to Population, based upon 150 Members |
|
E |
Apportionment according to Property and Qualifications, based upon 150 Members |
|
F |
Members in House of Delegates in 1846, if the same rule is adopted as fixed by the Constitution. |
|
G |
Apportionment according to Population, 36 Members |
|
H |
Apportionment according to Property and Population, 36 Members |
|
|
White Population |
House of Delegates |
|||||||||||
|
|
By Census |
By Census |
By Tithables |
------------1830------------ |
------1840----- |
---------------------1846--------------------- |
|||||||
|
Districts |
1830 |
1840 |
1846 |
A |
B |
C |
B |
C |
B |
C |
D |
E |
F |
|
First |
167001 |
170530 |
180598 |
36 |
32 |
36 |
31 |
35 |
30 |
35 |
33 |
39 |
34 |
|
Second |
208656 |
198868 |
207465 |
42 |
40 |
45 |
36 |
40 |
34 |
38 |
38 |
43 |
36 |
|
Third |
134791 |
136796 |
148848 |
25 |
27 |
25 |
25 |
24 |
24 |
24 |
27 |
26 |
22 |
|
Fourth |
183854 |
234774 |
284074 |
31 |
35 |
28 |
42 |
35 |
46 |
37 |
52 |
42 |
42 |
|
|
694302 |
740968 |
820985 |
134 |
134 |
134 |
134 |
134 |
134 |
134 |
150 |
150 |
134 |
|
|
White Population |
Senate |
||||||||||
|
|
By Census |
By Census |
By Tithables |
------------1830------------ |
------1840----- |
-----------------1846---------------- |
||||||
|
Districts |
1830 |
1840 |
1846 |
A |
B |
C |
B |
C |
B |
C |
G |
H |
|
First |
167001 |
170530 |
180598 |
19 |
8 |
8 |
7 |
8 |
7 |
8 |
8 |
9 |
|
Second |
208656 |
198868 |
207465 |
10 |
11 |
9 |
9 |
8 |
9 |
10 |
10 |
|
|
Third |
134791 |
136796 |
148848 |
13 |
6 |
6 |
6 |
6 |
6 |
6 |
6 |
7 |
|
Fourth |
183854 |
234774 |
284074 |
8 |
7 |
10 |
9 |
11 |
9 |
12 |
10 |
|
|
|
694302 |
740968 |
820985 |
32 |
32 |
32 |
32 |
32 |
32 |
32 |
36 |
36 |
Transcriber Notes
The following counties would leave Virginia during the Civil War to form West Virginia:
|
Barbour |
Hampshire |
Marshall |
Pocahontas |
|
Berkeley |
Hardy |
Mason |
Preston |
|
Braxton |
Harrison |
Mercer |
Randolph |
|
Brooke |
Jackson |
Monongalia |
Ritchie |
|
Cabell |
Jefferson |
Monroe |
Taylor |
|
Doddridge |
Kanawha |
Morgan |
Tyler |
|
Fayette |
Lewis |
Nicholas |
Wayne |
|
Gilmer |
Logan |
Ohio |
Wetzel |
|
Greenbrier |
Marion |
Pendleton |
Wood |
Note that there is an error in the total for Counties in the Second District for 1846. The total shown is 207,465 and it should actually be 207,475. Today the computer makes it easy to verify a total.
 Folders
- Information
- 1700s
- 1800 - 1819
- 1820 - 1839
- 1840 - 1859
- 1860 - 1879
- 1880 - 1899
- 1900 - 1919
- 1920 - 1939
- 1940 - 1999
- Drawings
- 2000s
- Practical Arithmatic
- Memo Book: JTG 1819
- Ledger: JTG 1827-1834
- Ledger: JTG 1836-1841
- Ledger: JTG 1841-1849
- Ledger: JTG 1849-1854
- Ledger: JTG 1852-1855
- Ledger: JTG 1854
- Ledger: JTG 1859-1868
- Catalogue: Emory & Henry
- Ledger: GWG, Tax Collection, 1850
- Ledger: JTG Jr 1850
- Diary: Betty Gleaves
- Acct Bk: Wythe Minute Men
- Ledger: East Tennessee
- Ledger: Company Description 1863
- Ledger: RHG 1870s
- Ledger: RHG 1876-1882
- Ledger: RHG 1882-1901
- Inventory: E. K. Byrd
- Ledger: Misc 1870s
- Writings: Laura Keene Gleaves
- Cookbook: 1893 Ladies Aid Society
- Order Bk: JTaylorG
- Ledger: JTaylorG 1909-1919
- Ledger: JTaylorG 1909-1945
- Writings: Anna Gleaves Rich
- References